Introducing Vitals: track what only you can describe
.jpg)
October 1, 2026
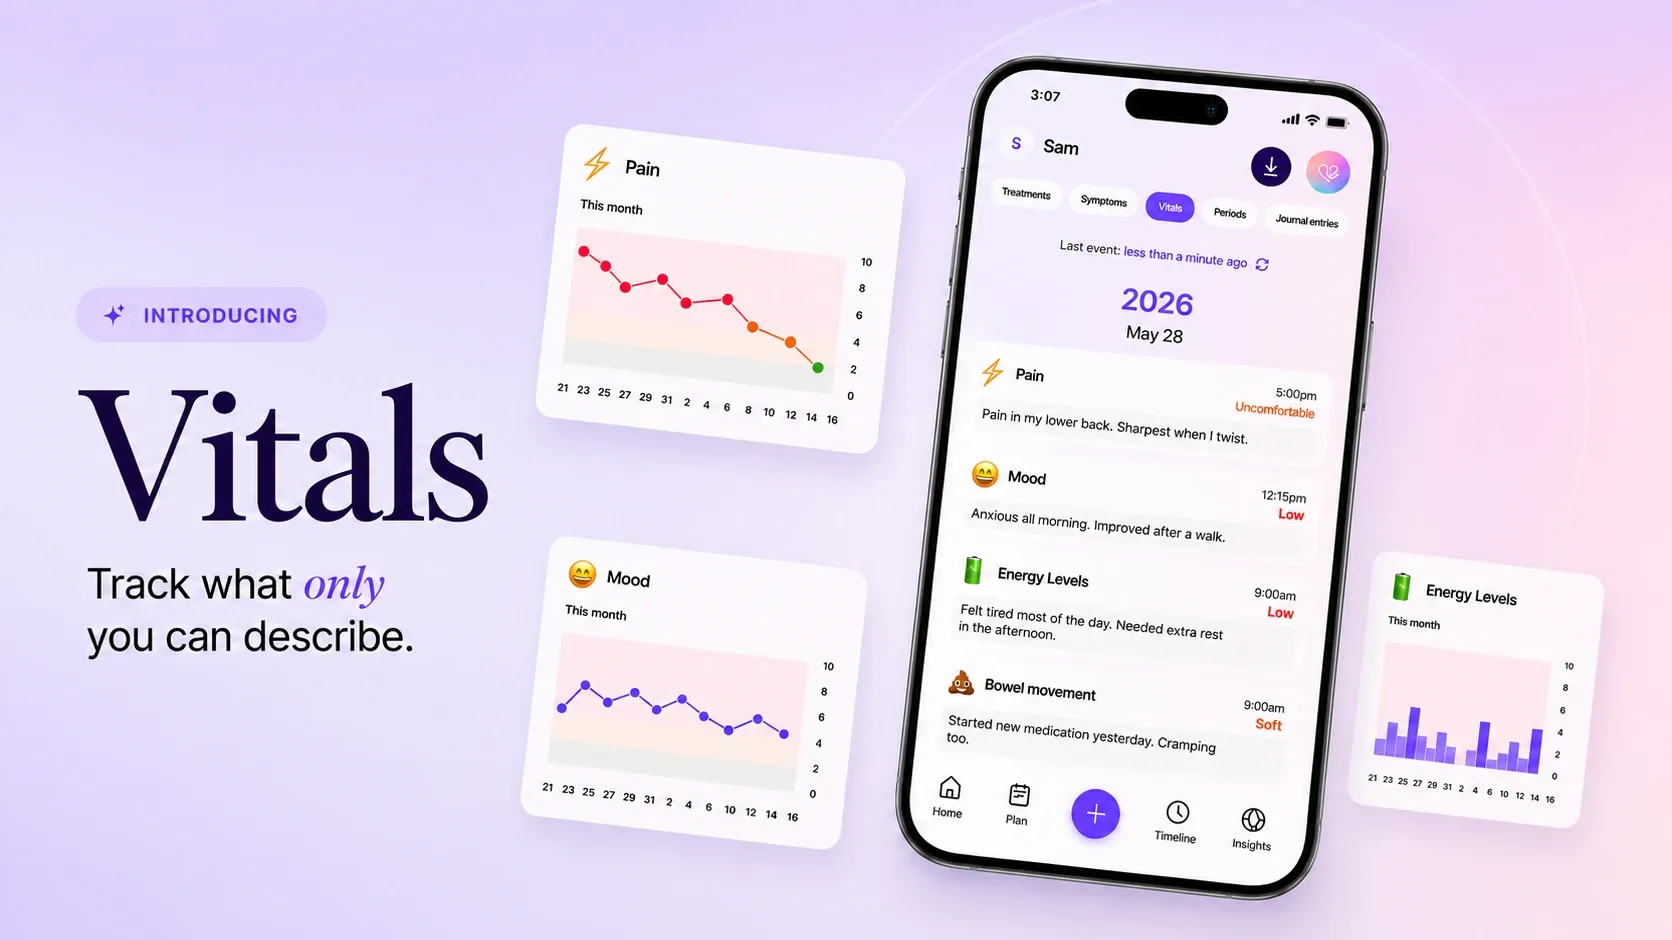
Some of the most important signs of chronic illness don't fit in a symptom tracker. The drop in your energy levels, the shift in your mood, the pain that's hard to put a number on after it's gone. You notice them, but there's no easy way to record them, so they never make it into the picture your care team sees.
Those signs - pain, energy, mood - are exactly what Vitals is built to track. Now you can log them in 30 seconds and see them charted next to your symptoms and treatments, so patterns start to show, and you walk into your next appointment with everything in one place.
Why we call them Vitals
In a hospital, your vital signs are the quick readings, like heart rate, temperature, blood pressure, that tell your care team how you're doing right now.
With a chronic illness, some of the most important signs never show up on a machine. Your energy, your mood, your pain: these are just as vital, and often only you can report them.
It's why we grouped them with more traditional Vitals, like blood pressure, so you can capture the complete picture of everyday readings that show how you're really doing in one place.
A symptom tracker is typically used for what's wrong: you open it to log a flare, a bad night, a spike in discomfort. But a vital sign isn't always a complaint. It's a reading, and a good reading is worth capturing too. Vitals let you mark where you are on any given day, where that be steady, better, or worse, so the good days leave a trace instead of disappearing.
How it works
We're starting with five Vitals, and more are on the way.
- Pain: Score it from 0 to 10 in the moment, and see at a glance whether today is fine, worth watching, or worth a call to your care team.
- Energy level: Track how depleted or charged you feel.
- Mood: A picture-based scale, so it's easy to match how you feel inside.
- Bowel movements: Based on the Bristol stool chart that doctors use. It captures the detail your doctor wants, without you having to find the words.
- Blood pressure: Log your systolic and diastolic readings and watch your numbers trend over time.
Your Vitals over time
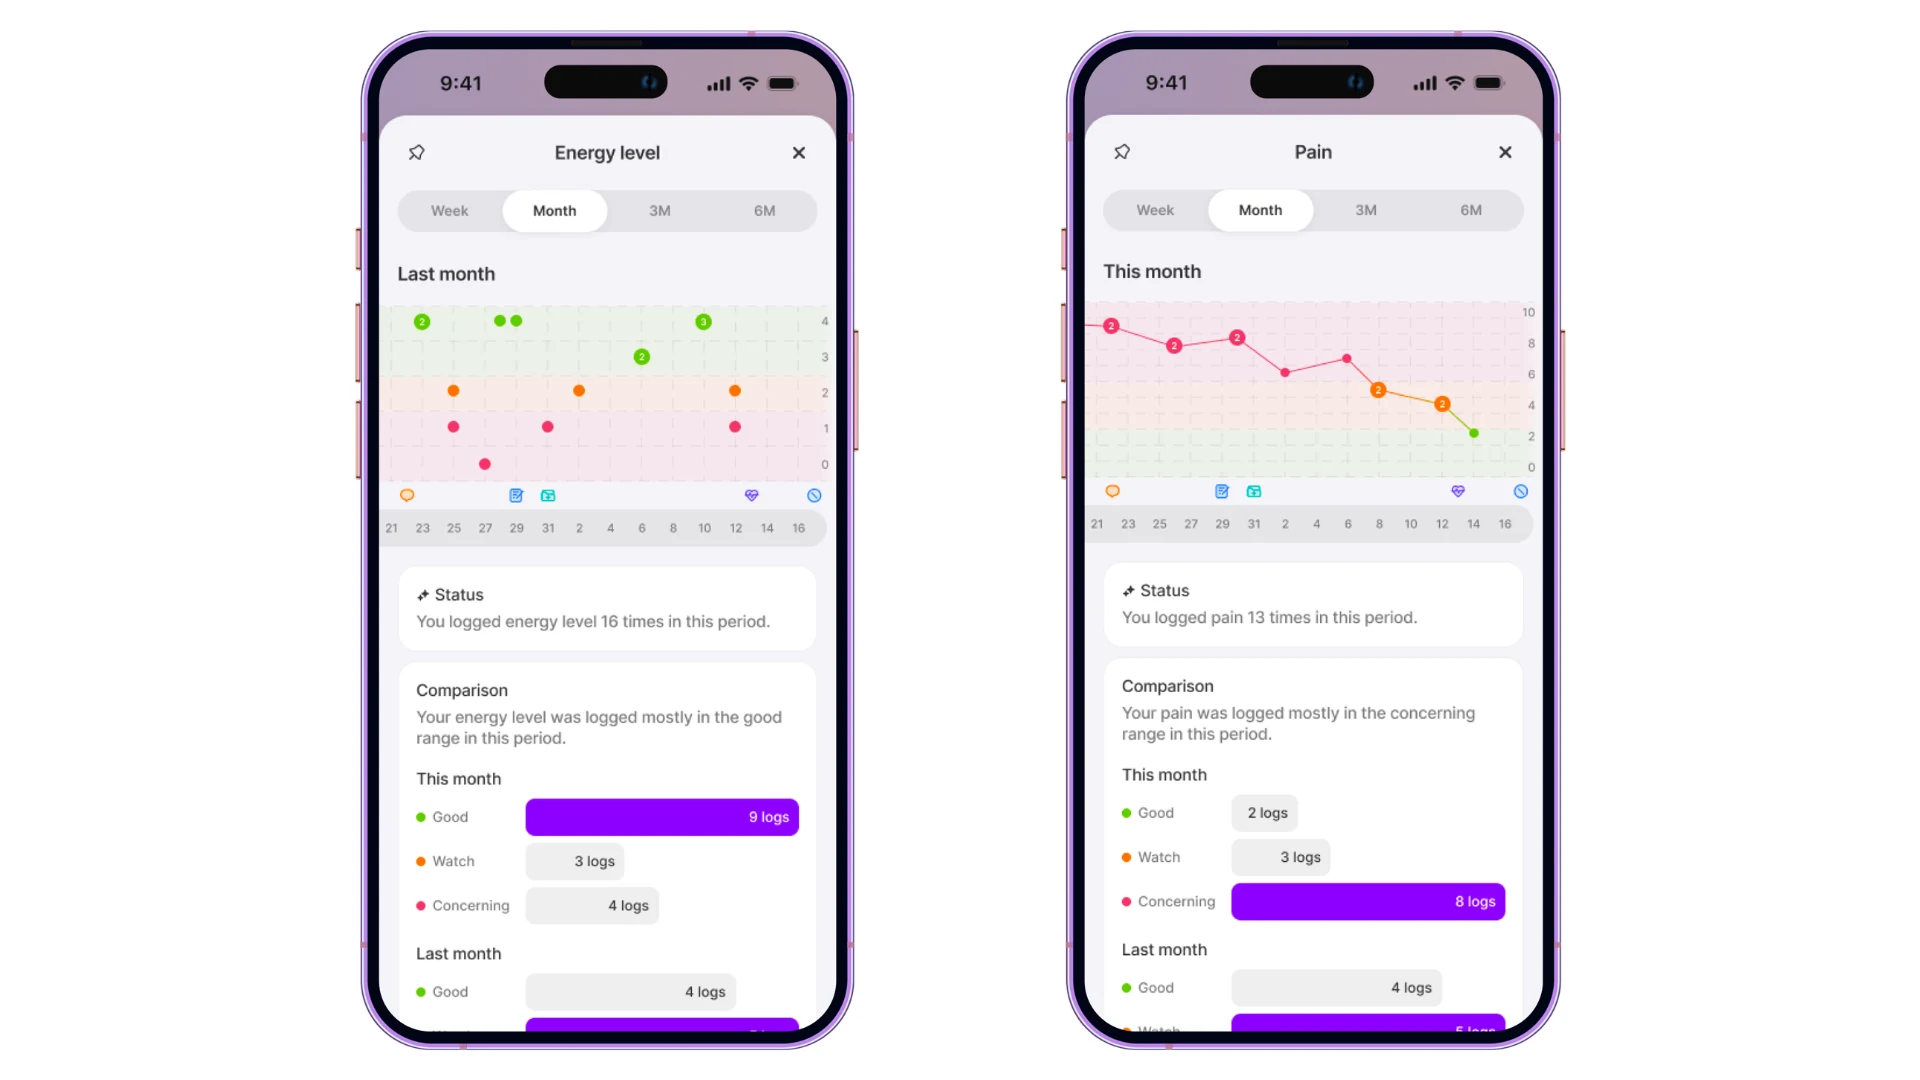
You'll get a new view of your Vitals over time from your Insights page. Every entry shows up on the chart, with shaded bands behind the points to mark where each one falls: good, watch, or concerning. The bands give you a quick read on how you're doing, so you don't have to remember what a 7/10 pain score means in context.
You can also compare this time period against the last one to see whether things are heading in the right direction.
And because you log the good days alongside the hard ones, the chart shows your real range, not just the dips. That's what makes progress visible: you can't see yourself improving if the only thing you ever record is what's wrong.
How to track Vitals
Vitals tracking is free for all Human users. Here's how to get started:
- Tap the add (+) button in the toolbar at the bottom of the screen.
- Tap the Vitals card in the stack.
- Pick the Vital you want to track.
- Log it using the scale or, for blood pressure, entering your readings into the form.
- Log as many times a day as you like.
.webp)
The bigger picture
You've always known these signs mattered. Now they're logged, tracked, and ready to share, so nothing important goes unnoticed. It's a new way to follow your health in Human, with the same goal as always: to take some of the weight of managing a chronic illness off your shoulders, so you can put your energy into living well.
This is a div block with a Webflow interaction that will be triggered when the heading is in the view.

Learn more

Research matching with Human: Your data, new discoveries


Privacy and Security at Human Health

A spreadsheet and two sick kids: why Human Health exists
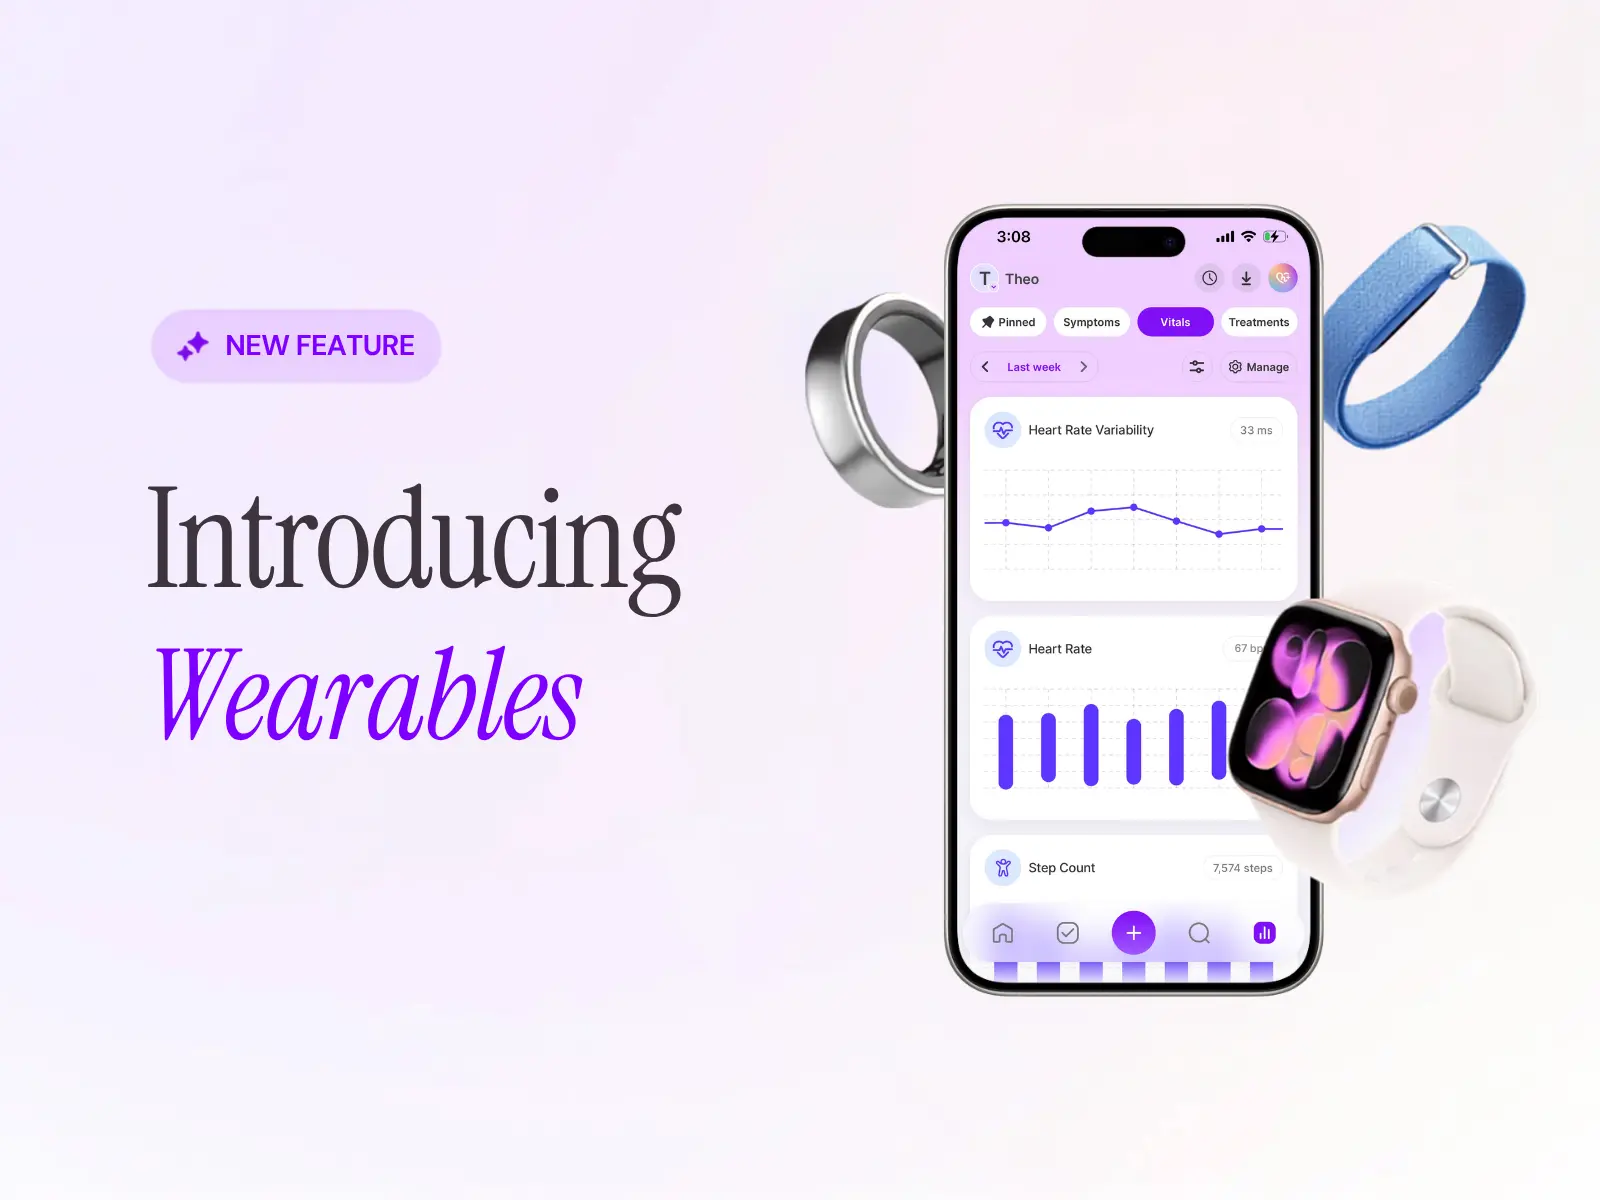
It's already on your phone. Now it's in Human.

HIPAA Audits: What is it and what does it mean for you?


.png)


